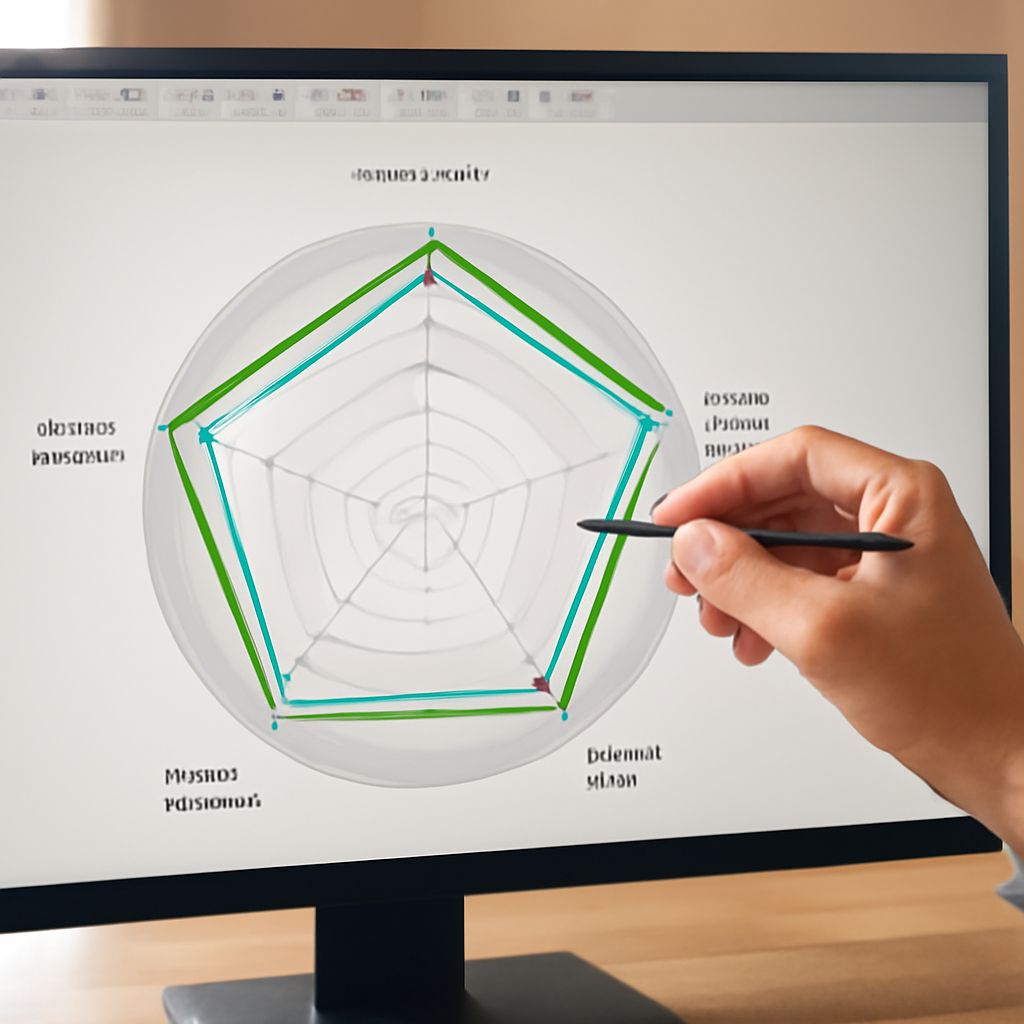
Presenting complex data can be a challenge, but a radar chart maker allows you to turn multi-dimensional figures into clear, eye-catching visuals. With the right spider chart maker, you can organize, compare, and communicate results across teams, stakeholders, or classrooms—without advanced design skills or coding. Here’s how these tools help you visualize patterns and make your presentations stand out.
What Is a Radar Chart Maker?
A radar chart maker is a specialized tool that helps you create radar charts, also known as spider charts or web charts. These charts show data across multiple categories, using axes that radiate from a central point. Each axis represents a variable, and data points are plotted and connected, forming a distinctive polygon or “web.”
Radar chart makers are available as standalone web apps, built-in features in spreadsheet software, or even as plugins for popular platforms. You typically enter your data in a spreadsheet-style format, select your categories, and the tool generates a customizable chart. This process saves time and helps you avoid manual errors compared to drawing charts by hand.
Some advanced radar chart makers allow you to add multiple data series, so you can compare different individuals, teams, or products on the same chart. This versatility makes them ideal for performance reviews, skill assessments, market analysis, and more.
Benefits of Using Spider Chart Makers
Using a spider chart maker offers several clear benefits for anyone who needs to present or analyze complex data sets. First, it improves clarity by transforming numbers into shapes that are easy to compare visually. Instead of scanning through rows and columns, your audience can instantly spot strengths, weaknesses, and outliers.
Spider chart makers also save time and reduce the learning curve. You don’t need to be an expert in graphic design or data visualization. Most tools offer step-by-step workflows, clear templates, and smart defaults, so you get professional-looking results with minimal effort.
When sharing results, these tools make it easy to export your chart as an image, PDF, or even an interactive graphic. This flexibility supports different presentation styles, from static slides to web dashboards. Teams can collaborate or share findings more effectively, especially if the tool supports real-time editing or cloud storage.
Finally, spider chart makers promote consistency. By standardizing the way data is visualized, you ensure that results are easy to compare across teams, projects, or time periods. This is especially valuable in business environments where regular reporting is required.
Key Features to Look For
When choosing a radar chart maker, focus on features that match your workflow and presentation needs. The most important feature is ease of use—look for tools with intuitive interfaces and clear instructions. Importing data should be straightforward, whether you’re copying from a spreadsheet or uploading a file.
Customization is also crucial. You’ll want options for adjusting colors, labels, axis scales, and the overall chart style. This ensures your radar chart fits with your branding or presentation theme. Some tools offer the ability to add multiple data series, so you can easily compare groups or trends.
Interactivity can take your presentations to the next level. Features like tooltips, clickable data points, or the ability to hide and show series help audiences engage with your chart. For web-based presentations, look for export options like SVG or HTML.
Collaboration is another key consideration. If you work in a team, choose a spider chart maker that supports sharing, commenting, or real-time editing. Integration with cloud storage services like Google Drive or Dropbox can streamline your workflow. Finally, prioritize tools that support high-resolution exports, especially if you plan to print your charts or include them in reports.
Popular Radar Chart Maker Tools
Several radar chart makers stand out for their features, accessibility, and ease of use. Microsoft Excel remains a go-to option for many professionals, offering built-in radar and spider charts with customizable settings. While it’s familiar and widely available, its customization options are not as advanced as some specialized tools.
Canva offers a user-friendly online platform with drag-and-drop design, modern templates, and plenty of customization features. It’s ideal for creating polished visuals for presentations or social media, though it may have limits for large data sets.
ChartExpo provides an advanced radar chart maker with automation and dynamic interactivity, making it a strong choice for data analysts and business users. It integrates with Excel and Google Sheets, making updates and collaboration fast and simple.
Visual Paradigm Online offers a powerful, browser-based spider chart maker. It supports collaborative editing, multiple export formats, and a wide range of styling options, making it a favorite among project managers and educators. For open-source enthusiasts, RAWGraphs is a free, flexible option that allows in-depth customization and data privacy.
Each of these radar chart makers has unique strengths, so consider your project needs, collaboration requirements, and preferred workflow before deciding. With the right tool, you can transform complex data into clear, actionable insights—helping your audience see the bigger picture at a glance.